Statistics
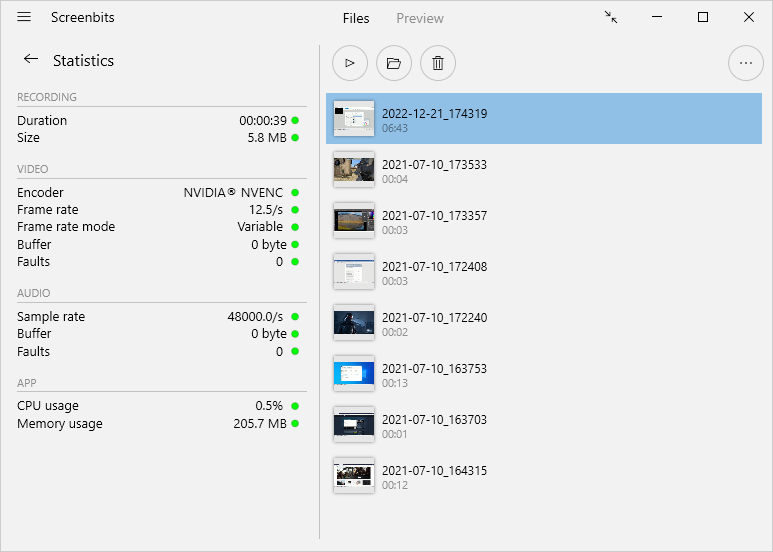
Statistics feature shows the information about current recording session including output size, output duration, actual recording frame-rate and resource usage of the application. This feature also helps monitoring health of recording to make sure the output is going to be as good as expected.
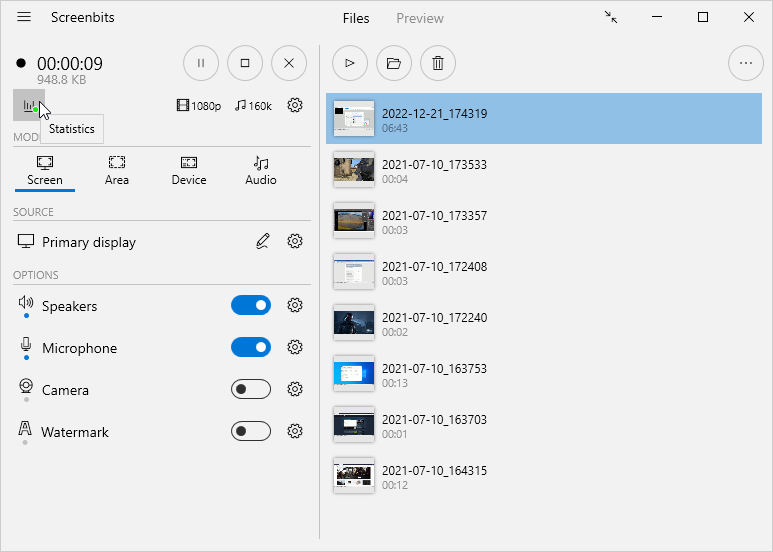
To view statistics, click Statistics button from application window during recording.
Statistics list contains multiple rows with a circle on the left side of each row which shows the health of the related operation. A green circle indicates a healthy state while a red circle indicates an unhealthy state. You can see the description for each item of the list on the table below.
| Title | Description | Meaning of an unhealthy state |
|---|---|---|
| Duration | Duration of recording | (none) |
| Size | Size of the output file | Running out of storage space |
| Frame rate | Current recording frame rate | Too many frames are being dropped |
| Frame rate mode | Current frame rate mode | Switched to variable frame rate mode due to performance issues |
| Buffer | Amount of memory used for video encoding | Too much memory is being consumed due to encoding lag |
| Faults | Total number of missed frames | Too many frames are dropped in the current recording session |
| CPU usage | CPU usage of the application | CPU usage of the application is higher than usual |
| Memory usage | Memory usage of the application | Memory usage of the application is higher than usual |
If the stats are constantly in unhealthy state every time you record, follow the instructions on Performance page to get have healthy recording session.

